BRENT’S NATIONAL BUSINESS REVIEW ARTICLES
The reports below were published recently in the National Business Review.
OCTOBER 2017
ABOUT BANKS, BORROWINGS AND HOUSE PRICES
As we saw last week analysts are looking around to see what could cause the next crash. High house, bond and share prices are, as usual, amongst the usual suspects. However in any crash scenario the banking system is likely to be front and centre as bank leverage is extraordinarily high, much higher than what is disclosed. First an historical perspective: back in 1931 the news that major Austrian bank, Creditanstalt, had incurred bad debts equivalent to most of its equity helped trigger the Great Depression.
So why is bank gearing understated? The various Basel Accords allow banks to materially downsize the level of their borrowings when they calculate their capital ratios. Let’s look at ANZ’s NZ operation for example. In its June 2017 report it declared that it had a capital ratio of 14.2% suggesting $14.2 of equity for every $100 of assets. This number however is flattered by Basel which allows banks to risk weight their loans. ANZ NZ has $77.8 billion in retail mortgage exposure but under the Basel Accord the retail mortgage debt is assessed as being low risk thus $77.8 billion falls to just $16.9 billion on a “risk adjusted” basis. Conversely lending to companies is deemed more risky so ANZ’s $49.6 billion in corporate loans falls “only” to $29.8 billion. A material crash in residential property prices whereby ANZ took a loss of 15% on its residential mortgage portfolio could conceivably wipe out its equity. If we look at ANZ’s balance sheet its total liabilities are more than 10x total equity. “Total exposure at default” is estimated at $178.8 billion versus total capital of $12.1 billion. Even these numbers may understate risk because “market related contracts” which are presumably derivative contracts – interest rate and fx swaps - amount to $959bn. Any problems in this market could hugely impact ANZ’s thin sliver of equity. It is important to note that ANZ’s capital position is not materially better or worse than the other banks.
One unintended consequence of Basel is that bankers can make more money financing a house than they can to industry. This is simply because, given a certain level of capital, a bank can lend much more money on residential mortgages than it can to business. In a recent paper Longview Economics argue that much of the huge growth in UK house prices is mainly due, not to a lack of housing supply, not to overseas buyers of UK properties, but the huge increase in supply and availability of mortgage debt since the late 1980’s. Longview argue that banks have favoured mortgage lending over lending to businesses due to the Basel Accords which progressively reduced the risk weighting of mortgages for regulatory purposes. According to Longview the average mortgage risk weighting in the four largest UK banks is just 13.4%.
The Longview data is for the UK however, as we all know, house prices in NZ have grown rapidly in the last twenty years. Infometrics data shows that the average rental yield on NZ residential property have fallen from 6.7% in 1993 to 3.5% in June 2017 therefore yield compression alone has contributed to a 3.0% pa increase in house prices. Everybody blames immigration, lack of supply etc but it’s likely that the same factors that have propelled UK house prices upwards are also a factor in NZ. Of equal concern is the possibility that the quid pro quo of lots of residential mortgages means a reduced supply of business finance.
Now if that wasn’t enough of a worry high levels of borrowings within banks, aided and abetted by risk weighting, is also a problem to taxpayers. This is simply because if any major bank gets into trouble the NZ Government will almost certainly guarantee their liabilities – bank deposits and senior bonds. Not to do so would risk contagion and a major economic meltdown. Back in 2008 when the phrase “too big to fail” became part of the popular lexicon politicians looked for a solution to this problem but as Martin Wolf, Economics Editor of the Financial Times, recently wrote “banking remains too undercapitalized for comfort as it relies on the alchemy of risk weighting”. He argued that bank leverage in the UK should be reduced from 25:1 to 5:1. There has been a similar lack of action in NZ which is not surprising given the cosy relationship between the National Government and the banks. Most local players sense that there has been little appetite by the government for substantive change which would lower the threat to the financial system posed by bankers as it also would mean lower profitability. This leaves taxpayers continuing to act as the lender of last resort for the banking system and in effect providing a defacto subsidy by way of a lower cost of debt for the major banks. It’s something of a “heads you lose, tails we win” scenario; the bankers know that they can take the risks, collect the rewards and if the “value at risk” models
February 2017
REPROGRAMMING THE KIWISAVER CALCULATORS
Two weeks ago we looked at long term forecast returns for international shares and bonds by consulting group McKinsy and Co and investment group AQR. Both of these institutions expect that returns in the next 30 years will be much lower than those in the last 30 years. Their average forecasts are 7% pa for shares and 3% pa for bonds before tax, fees and inflation. Other experts like John Bogle, founder of the Vanguard group and Jeremy Siegel, Professor of Finance at Wharton School of the University of Pennsylvania are also of the view that future returns will be subdued with Mr Bogle expecting a long period of 5% returns from shares, as valuations revert to the mean.
For an individual saving for retirement in a balanced KiwiSaver fund and incurring the average charge of 1.4% pa the after tax, after fee, long term returns can therefore be estimated as follows:
These low return forecasts for international shares and bonds are particularly significant for KiwiSavers, contributors to superannuation funds and investors generally because the average balanced portfolio has about 50% in shares, two thirds of which are in international shares. Typically 40% of the average balanced portfolio is in bonds, split between NZ and international, with the remaining 10% invested in property. Using this asset allocation and assuming 4.5% nominal returns on NZ bonds and a generous 7.5% pa for NZ and Australian shares we can calculate the weighted average forecast return for a typical balanced portfolio over the long term. A reasonable estimate of the long term post-tax, post-fee return for a balanced Kiwisaver fund is thus 3.9% pa.
Remember however that forecasts of future returns are just that, forecasts, but paradoxically it is far easier to forecast thirty year returns than it is to forecast returns for the next twelve months. Without going into too much detail returns are a function of two variables – the normal long term return and, as John Bogle calls it, the speculative return that arises from valuation changes. In the short term the speculative return can overwhelm the normal return but over the long run valuation changes become less significant. The NZ share market in particular has enjoyed a number of years of additional speculative returns and the jury is out as to whether valuations will return to average (lower) levels or stay elevated.
The biggest takeaway from the above is that if returns will be lower investors need to consider their investment options carefully. Despite the extensive fake news on the subject of retirement academics reckon that the three proven and reliable ways of improving outcomes are saving more (obviously), taking on more risk and reducing fees. For many individuals (and many institutional investors) saving more is not an option and reducing fees is the preferred strategy for increasing returns.
Now let’s take a look at some of the local Kiwisaver savings calculators to make sure that their growth forecasts are realistic. Choosing how you will save for retirement has probably never been more difficult. There are lots of alternatives – KiwiSaver, DIY investing, buying a house etc. Then there is the matter of asset allocation – how much do you invest in bonds, property and shares? All these variables will impact the terminal sum you save prior to stopping work for good. Sounds complicated doesn’t it, but it just got worse because there is a new variable added to the mix and that is – what savings calculator you use to forecast your savings. Pick the right one and you could be thousands of dollars better off come retirement day. Make the wrong choice and you may still be working when you are 70.
Too sarcastic maybe, however it is easy to be critical about fund manager’s choice of return forecasts. Formal intervention from the regulator looks inevitable especially given, as the FMA recently noted, the extent of the information asymmetry between product providers and consumers. The significance of overstating returns is not just academic. It can lead to bad decisions and bad outcomes in the real world. If you expect your investment to return 8% pa and it returns just 4% you may not have saved enough for your retirement. In the AQR analysis which we looked at in the first installment of this Kiwisaver series the authors made the point that future returns are likely to be lower than historic. The Economist Magazine reviewed the AQR report and noted that one of the reasons why individuals saving for retirement may not save enough is that they “may have been deceived by the robustness of past returns”. The major culprit in that deception is of course fund salespeople. The AQR analysis suggests that a 1% reduction in portfolio returns (from 5.5% to 4.5% real) requires 3% in additional savings per year to achieve the same nest-egg value. That’s huge. The additional significance of this figure is that if you are paying 1% more in fees than you need to you may be required to contribute 3% more in savings to achieve the same retirement outcome. The full AQR analysis is available at: CLICK HERE
Now, armed with reasonable forecasts of long term returns and actual fees and tax, we can take a critical look at some of the KiwiSaver calculators available locally and ask the question “is this realistic?” The table below sets out the after fee, after tax returns used in Kiwisaver calculators made available by various companies and the Commission For Financial Capability for a long-term savings plan with a balanced portfolio of 40% bonds and 60% shares. Both the growth rates and the results are in nominal terms, i.e. are not inflation adjusted. The terminal sum is calculated for an individual aged 35 and retiring at age 65, earning $75,000 with employer and employee contributions of 3%, wage growth of 2.5% pa and receiving a KiwiSaver subsidy from the government of $521 per year.
As the table illustrates local Kiwisaver calculators can predict widely different terminal sums for the same savings plan. The range here is a $310,000 terminal sum assuming a 3.9% pa return to $399,000 assuming a 5.5% return. However just looking at the return forecast is not the full story – for example the 5.5% pa forecast return from Simplicity might look optimistic however it becomes more realistic when one remembers that their annual fee is about 1.0% below that of the average KiwiSaver provider. One Kiwisaver manager which isn’t in the table uses a 6.92% return to give a terminal sum of $503,000 which looks most unrealistic given their fee structure is 40% above the average used in this analysis.
So Kiwisavers be careful – it’s a jungle out there and remember the old rule that if it looks too good to be true it’s probably a lie. In two weeks’ time we will consider a number of frequently asked questions on Kiwisaver and construct our answers based on a reasonable low return scenario. To preview the results - some of the answers are highly dependent on return assumptions.
June 2016
FUND MANAGER OF THE YEAR …. OR NOT
So the waiting is finally over: … (sound of trumpets in background) … ladies and gentlemen the 2016 INFINZ fund manager of the year award for equities goes to Salt Fund Management and the winner in the bond category is Fisher Funds. Cue wild cheering, the reading of congratulatory telegrams from the Queen and, predictably, the NZX, and law firms seeking advisory business. Video footage of the glorious event records wide smiles, perfect teeth, enthusiastic backslapping and high fives all round but, in the audience, puzzled looks from some retail investor clients of the fund managers concerned.
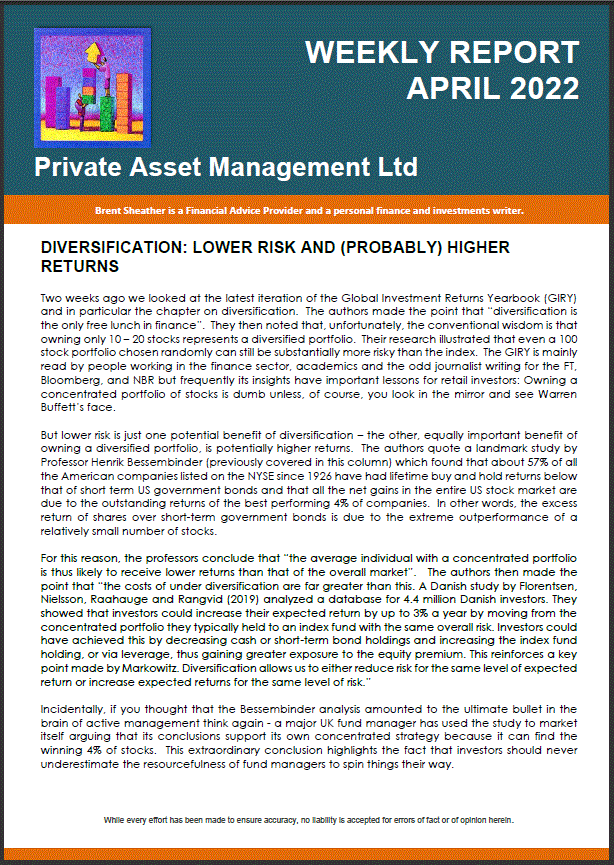
This week we are going to take a closer look at these INFINZ Fund Manager of the Year awards. First some background - each year INFINZ holds a black tie awards dinner where it recognises and acknowledges the success of finance industry participants. The INFINZ awards cover debt market issues, M&A transactions, debt deal of the year etc etc. However for the average retail investor the most relevant awards are those for excellence in equity and bond fund management. As yet there are no awards for share price manipulation, foreign exchange rate fiddling or interest rate swap mis-selling.
Even though I have been a member of INFINZ and its predecessor organization, the Society of Investment Analysts since 1986, I have always been pretty cynical of these FMOTY awards. Indeed they have a very checkered past in NZ, particularly those awards where the winners were chosen by financial advisors. Although the criteria wasn’t always obvious one suspects it had more to do with the amount of commissions paid and the extent to which the said fund manager sponsored pseudo-CPD junkets in exotic locations. Back in the day Armstrong Jones dominated the fund manager of the year awards and was even voted fund manager of the decade (LOL). In 1998 a client came to see me with a question – he had recently invested $500,000 through my firm in a range of managed funds and noticed that not one of the managed funds were managed by Armstrong Jones. Yet he had just read, in a full page newspaper ad, that Armstrong Jones had been named (trumpets in the background) fund manager of the decade. Why, he said, weren’t we buying Armstrong Jones? I thought this could make an interesting Herald article so after researching Armstrong Jones’ performance and fees I faxed a draft to Armstrong Jones asking them to advise any errors of fact. Shortly thereafter I got an email from a Mr C A J Clark, senior associate of Bell Gully Buddle Weir, telling me that “our client remains concerned that the article you intend to publish will contain inaccuracies and this letter is to put you on notice that our client, in all respects, reserves the right to pursue appropriate legal action upon publication”. Armstrong Jones refused to advise any errors of fact so that effectively stopped publication of the story. It is ironic that it was more than likely the silly old Armstrong Jones unit holders who were funding the legal action. Thankfully Armstrong Jones is no longer around.
Anyway back to the latest incarnation of FMOTY. The judges for both the share and bond awards were David May, former Chairman of the NZ Super Fund, James Ogden former CEO of Macquarie and Mark Weaver, an actuary with Melville Jessop Weaver. According to the INFINZ website criteria included past performance and various qualitative airy - fairy factors like culture, creative thinking, stable corporate structure blah blah blah. A cynic like this writer might observe however that all these intangible variables are eventually expressed in returns which are the bottom line for mum and dad, retired and living in Kaitaia, together with a related non qualitative variable, annual fees.
No surprises that that is what we focus on today. First up Salt Asset Management. They run a number of equity funds but one of their largest funds and the one which is arguably most indicative of their skills in the NZ stock market and has a long track record is the NZ Shares Plus Fund. It is only available to institutions but its arguably the purest expression of Salt’s management skills. The pre-fee performance is summarized in the table below less a notional retail management expense ratio. Goodness me after the notional fee deduction it has marginally underperformed the NZ stock market in the long term (5 years) and more substantially in the short term. Even pre-fees the performance over 5 years is only 18 basis points pa above the index.
Now let’s look at the winner in the bond category. The performance of the Fisher Fund, pre-fees, is detailed in the table below and from that we have deducted the notional level of fee that a retail investor would pay at 0.9% pa, based on the actual fee of a Fisher Fund retail bond fund. This comparison shows that the fund has marginally underperformed in both the long and the short term, after fees.
So all in all not a great deal of outperformance there but the decision to award Salt and Fisher Funds FMOTY by Messrs May, Ogden, Weaver and INFINZ is even more perplexing if you look at the fees they charge their retail clients. Research by Morningstar shows that annual fees are the best indicator by asset class of future performance. Various academics around the world are also on record as saying that costs are vitally important when choosing a fund manager. Despite that revelation costs don’t appear to have been considered when determining who was “best in show”. Looking at the management fees charged by Salt and Fisher on their retail funds suggests they are at least as high as most of their competitors and several times higher than comparable index funds. In addition both managers charge performance fees on other funds they manage, calculated using non representative benchmarks. This practice has been recently criticized by the FMA. Not the sort of thing you would expect a FMOTY to do is it?
So how on earth did INFINZ and the judges get to their conclusion? I asked Jim McElwain of INFINZ for some background. He advised that when assessing Salt they looked at the performance of just one of Salt’s share funds and that was the NZ Dividend Fund. They then compared its performance with the NZX 50 Index and noted that it had outperformed. Oh dear, there are two obvious problems with this analysis. Firstly, Salt has lots of NZ share funds so why focus on just this one – the award is for equity FMOTY not high yield equity FMOTY. Choosing this fund is all the more surprising given that it only represents around $84 million of funds under management whereas the Salt NZ Share Plus Fund has around $450 million under management. Furthermore because the NZX 50 Index includes all the NZX 50 components and not just high dividend paying stocks it’s difficult, if not impossible, to tell whether the outperformance of the Salt High Yield Fund was due to management skill or the fact that the portfolio was tilted toward high yielding stocks. INFINZ should have assessed performance against all of Salt’s equity offerings or focused on a more representative portfolio like the Salt NZ Shares Plus Fund but, hello, that wouldn’t have worked out so well because it has underperformed. Stage one of any finance paper, not to mention commonsense, is to ensure that, when assessing a fund’s performance, that you have a representative benchmark.
When assessing the Fisher bond fund which has a 35% weighting in higher risk non-government bonds INFINZ and the judges have benchmarked it against the NZ Government Stock index which is obviously 100% invested in NZ Government bonds. Is the outperformance pre-fees due to duration management or the fact that the Fisher portfolio contains some more risky bonds which pay higher yields?
Hopefully next year INFINZ will have revisited their methodology for determining FMOTY.

